One of many small enhancements in Oracle APEX 5.0 is a small utility that can be used to help debugging an APEX application from SQLPLUS or sqlcl.
When you download and unzip APEX 5 you’ll find a utilities directory which includes a debug directory:
The debug directory contains 4 SQL scripts:
- d0.sql
- d1.sql
- d2.sql
- ds.sql
Now lets take a look at what those scripts are doing:
d0.sql
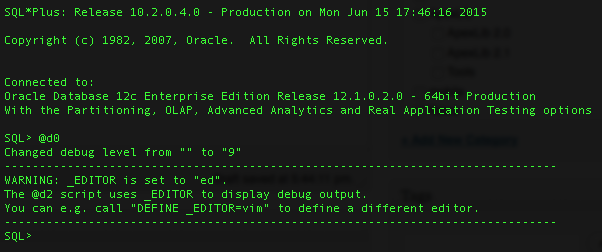
With d0.sql you log on to SQLPLUS using a privileged user and simply execute the script.
It immediately switches global debugging on. That means EVERYTHING on this instance will be debugged, every application in every workspace. This also includes the Application Builder, SQL Workshop and so on. So if you are working on a large system with many users and many applications you’ll have to think twice about using it. It is probably not a good idea…
Anyway, since we are connected to an internal DEV instance, it should be OK.
Running d0.sql a second time disables debugging again.
d1.sql and ds.sql
After you turned debugging and you ran some applications you can use d1.sql to list all debug sessions (page views, …). For that you need to make sure you are connected to the APEX schema:
Nice enhancement here is that it not only shows debug info of Page Loads (show) and Page Submits (accept), but also AJAX calls (ajax plugin) which are normally not shown in debug.
ds.sql actually does the same as d1.sql, but restricts the listing to a session-id you pass as argument:
d2.sql
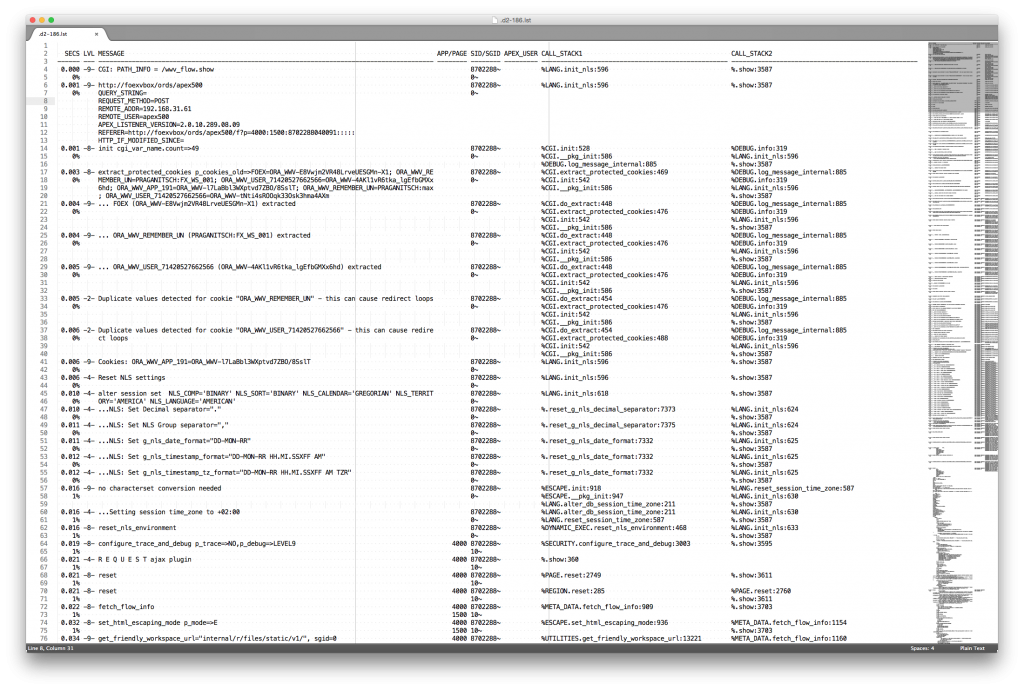
With d2.sql you pass a PAGE_VIEW_ID and it shows the detailed debug messages in your favorite editor.
So at first make sure to define what is your favorite editor. When you run d0.sql to enable debugging it shows how to use vim as editor for example: DEFINE _EDITOR=vim
Since my favorite editor on Mac is Sublime, I tend to use that by setting DEFINE _EDITOR=subl
Here is an example of @d2 186:
Why?
The big question there is: why would anyone want to use these tools instead of the regular debugging facility in the APEX UI?
To me it is a matter of doing things simple and quick. Enabling debug for the whole instance is quick and easy and it ensures it captures everything. Enabling debug in your application might miss important things, like AJAX calls triggered by native Dynamic Actions.
I know this is very low level and might be an overkill for most situations, but I do love to have that option.
Disclaimer
If you are new to APEX and still struggle with understanding what actually is going on, then I would recommend to stay clear of these tools for now and come back once you understand the impact of switching your instance to debug.
Edit 13.10.2021: add link to Christian Neumüllers Blogpost: https://chrisonoracle.wordpress.com/2020/04/03/debugging-apex-authentication-issues/

Nice one.
Thx for share.
Just a small question…You have shown session id:
0-87…40091
and
87…40091 (no “0-” as prefix)
What are the differences between them?
Brg
Damir
What you can see there is two session ID’s at the same time: 0 (zero, public) and 87….40091, because this is the Public Workspace Login Page
Very cool. Nice find!
Thank you for sharing!
best regards